When the NBA stopped rewarding ‘non-basketball moves’, who lost the whistle?
The natural experiment
Before the 2021-22 season, the NBA told officials to stop rewarding “non-basketball moves”: abrupt sideways or backward launches into defenders, hooking a defender’s arm, and similar tricks designed to draw a foul rather than score. It is the closest thing basketball has to a policy experiment on exactly the behavior this index measures.
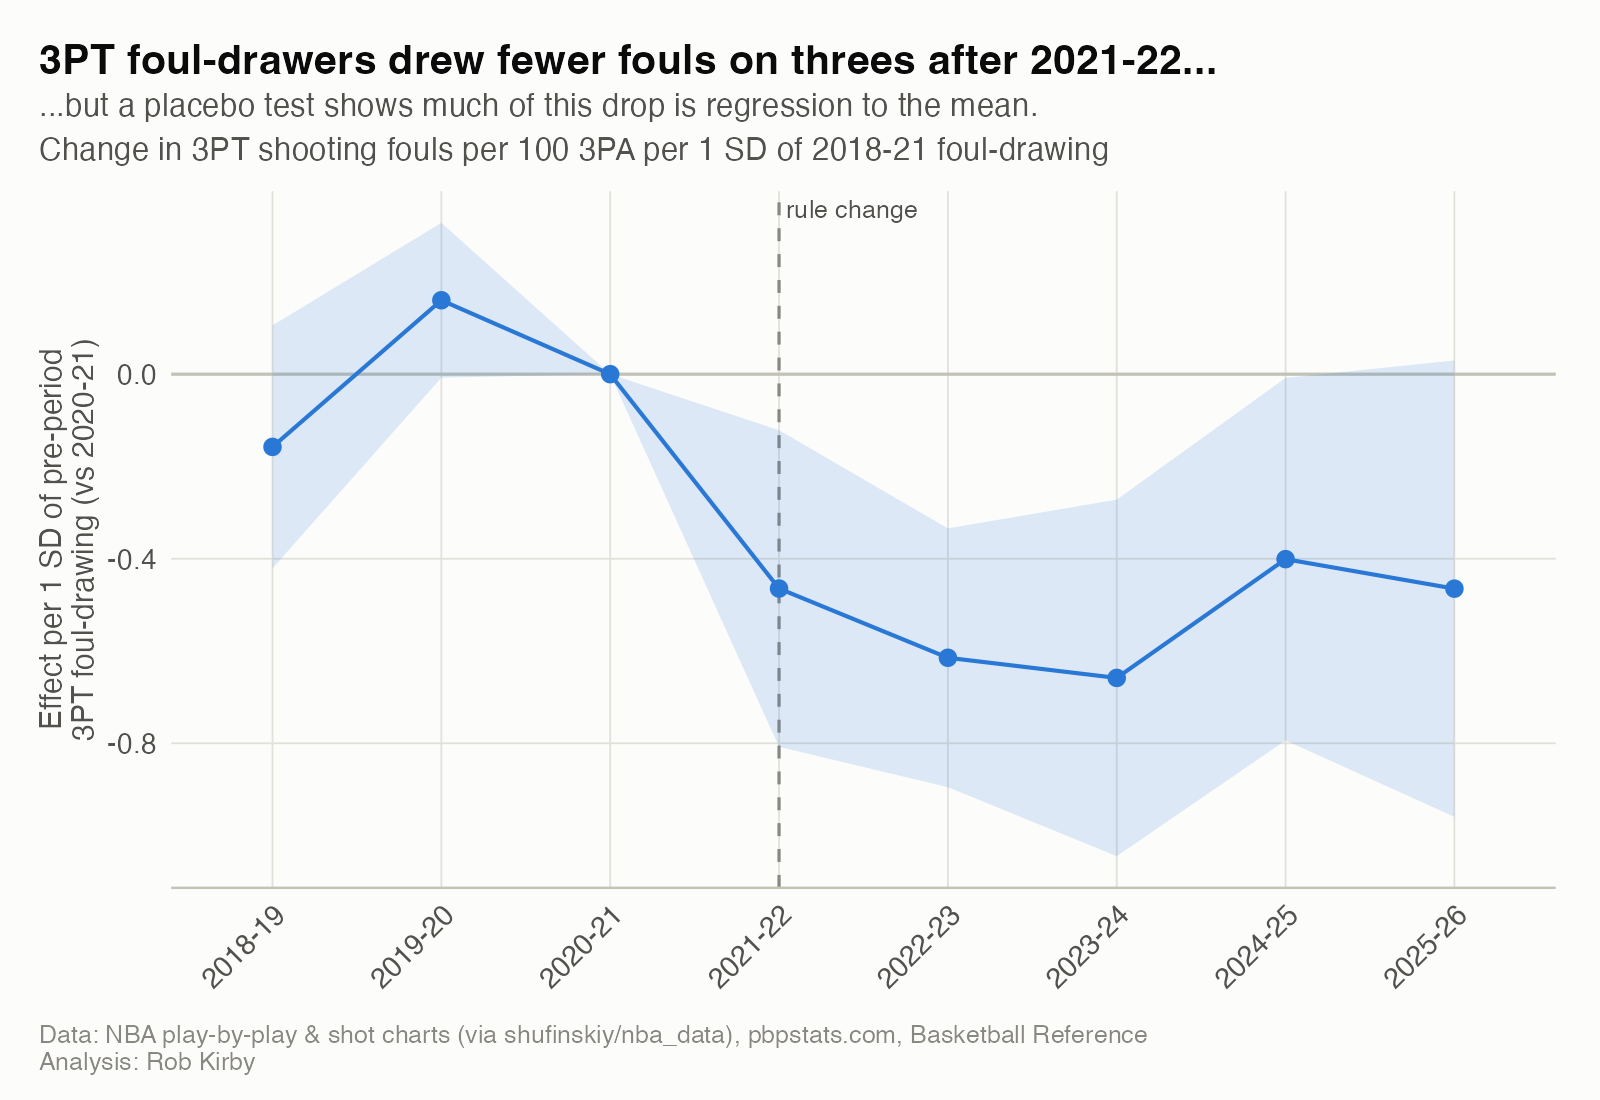
League-wide, the effect was immediate: three-point shooting fouls fell from 1.42 to 1.08 per 100 attempts in one season. The sharper question is whether the rule hit the players who had been leaning on those moves, and whether our index had flagged them in advance.
Design
Panel: regular-season player-seasons with 500+ minutes, 2018-19 to 2025-26. The minutes threshold deliberately ignores shot volume, so the sample isn’t filtered on the outcomes being measured. Treated players are those who were qualifying scorers before the rule (237 players).
Pre-period 2018-19 to 2020-21; post-period 2021-22 to 2025-26.
Treatment intensity: each player’s pooled pre-period three-point shooting-foul rate, standardized (continuous), plus a binary top-quartile version. An alternative uses the index’s own pre-period Whistle Score.
Specification: two-way fixed effects (player + season) difference-in-differences with standard errors clustered by player (fixest). Season effects absorb the league-wide drop, so estimates measure the differential change for heavier foul-drawers.
The trap: regression to the mean
Players picked because they drew unusually many fouls in 2018-21 will tend to draw fewer later even with no rule change. Extreme seasons don’t repeat. Two checks separate the rule from that drift:
Placebo: pretend the rule arrived in 2019-20, measuring treatment in 2016-18 and using only pre-rule seasons. Any “effect” there is pure drift.
Separate treatment window: measure foul-drawing in 2016-18, before the outcome window, so mean reversion can’t mechanically create the effect.
The headline estimate looks dramatic: each standard deviation of pre-rule foul-drawing predicts -0.53 three-point fouls per 100 attempts afterward (p < 0.001). But the placebo shows -0.38 (p < 0.001) with no rule at all, and measuring treatment in the earlier window shrinks the effect to -0.17 (p = 0.168). Most of the apparent targeting is regression to the mean. The rule clearly lowered three-point fouls for everyone, but this design can’t show it fell disproportionately on the prior foul-drawers.
Efficiency: a real, targeted hit
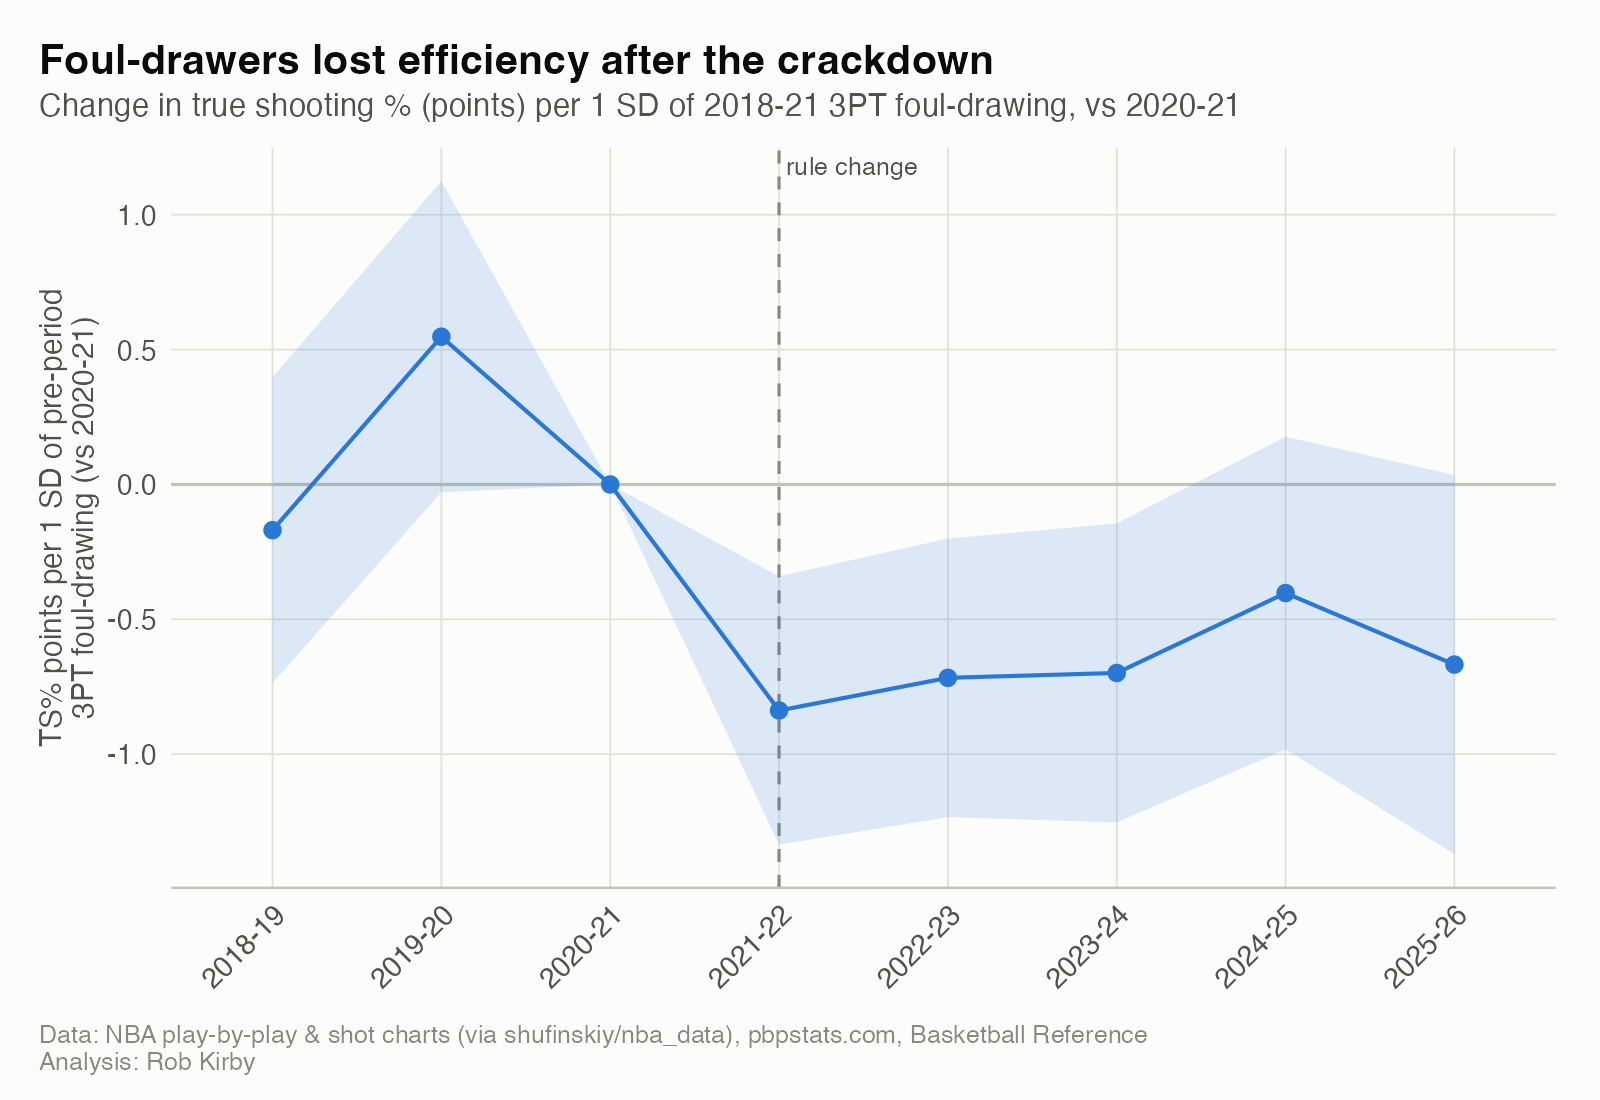
True shooting tells a cleaner story. Heavier pre-rule foul-drawers lost 0.83 TS points per standard deviation after the rule (p < 0.001). The effect survives every check:
the early treatment window (0.55 points, p = 0.010), so it is not mean reversion;
an age control (0.61 points, p < 0.001), so it is not aging foul-drawers;
while the placebo is flat (-0.05 points, p = 0.814).
The index saw it coming
Using the pre-rule EHI Whistle Score as the treatment, a measure built before and independently of the rule, each standard deviation of whistle-dependence predicts a 0.38-point drop in true shooting after the crackdown (p = 0.049). The players the index labeled as whistle-reliant are the ones whose scoring got less efficient once the league stopped rewarding non-basketball moves. That is external validation of what the Whistle Score measures.
The excess free-throw rate did not fall differentially (+0.003, p = 0.490). One reading: foul-drawers still got to the line on drives and contact at the rim, but lost the cheap jump-shot whistles that had padded their efficiency.
Caveats
Event-study pre-trends look flat partly by construction, because treatment is measured over the same pre-period. The placebo and early-window checks carry the identification weight.
The sample is small (237 players), and the binary top-quartile group even smaller.
Linear age is absorbed by player + season fixed effects; the age control is a quadratic term.
Other things changed after 2021-22 (pace, the take-foul rule in 2022-23). They hit all players, and season fixed effects absorb anything common to everyone.