Why 1996-97? It is the first season with NBA.com play-by-play and shot-location data, both required for every component. Starting there keeps all thirty seasons on one measurement system.
Data quality. The play-by-play matches official totals: for all player-seasons with 1,000+ minutes, field-goal attempts, free-throw attempts and turnovers agree with Basketball Reference within ±2 in every case. On a random sample of 25 player-seasons, the counts that drive this index agree closely with Basketball Reference’s independent play-by-play tables (correlations 0.998–1.000). Details on the Validation page.
Tracking data (Tier 2). The original design included NBA player-tracking data (drives, defender distance, 2013-14+) as a validation layer. The NBA’s stats server blocks automated requests, so that layer isn’t included yet. It was never an input to the index itself.
Cleaning: how each event is identified
Free throws drawn are credited to the free-throw shooter. Play-by-play logs the fouler on the foul row, not the fouled player.
Three-shot fouls: “free throw 1 of 3” trips. The fouled missed three is not logged as an attempt, so the denominator is three-point attempts plus three-shot trips.
And-ones: a “1 of 1” free throw by a player who made a field goal at the same game-clock moment (98% of all 1-of-1 trips; most of the rest are away-from-play and, since 2022-23, transition take fouls).
Self-creation: a made field goal with no assist credited.
Heaves (36+ feet with ≤ 3 seconds left in a period) are excluded everywhere. From 2025-26 the NBA logs missed heaves as team attempts, so excluding them keeps all seasons on one definition.
The 2012-13 season was missing its final 16 games in the primary archive. They were restored from the older-format feed using an event-code mapping learned from the 1,213 games present in both.
The expected-FG (xFG) model
To reward making hard shots, we first need to know how hard each shot was. The xFG model estimates the probability that a shot goes in from where and how it was taken: location, distance, angle, zone, shot family (jumper, layup, dunk, hook, tip), whether it came off a drive or on the move, period, game clock and season. It never sees who took the shot, otherwise it would absorb the very skill we are trying to measure.
Shot-type labels get more detailed over time (9 types in 1996-97, 50 by 2007-08; “step-back” and “pull-up” don’t exist early on), so the model uses five shot families that exist in every season.
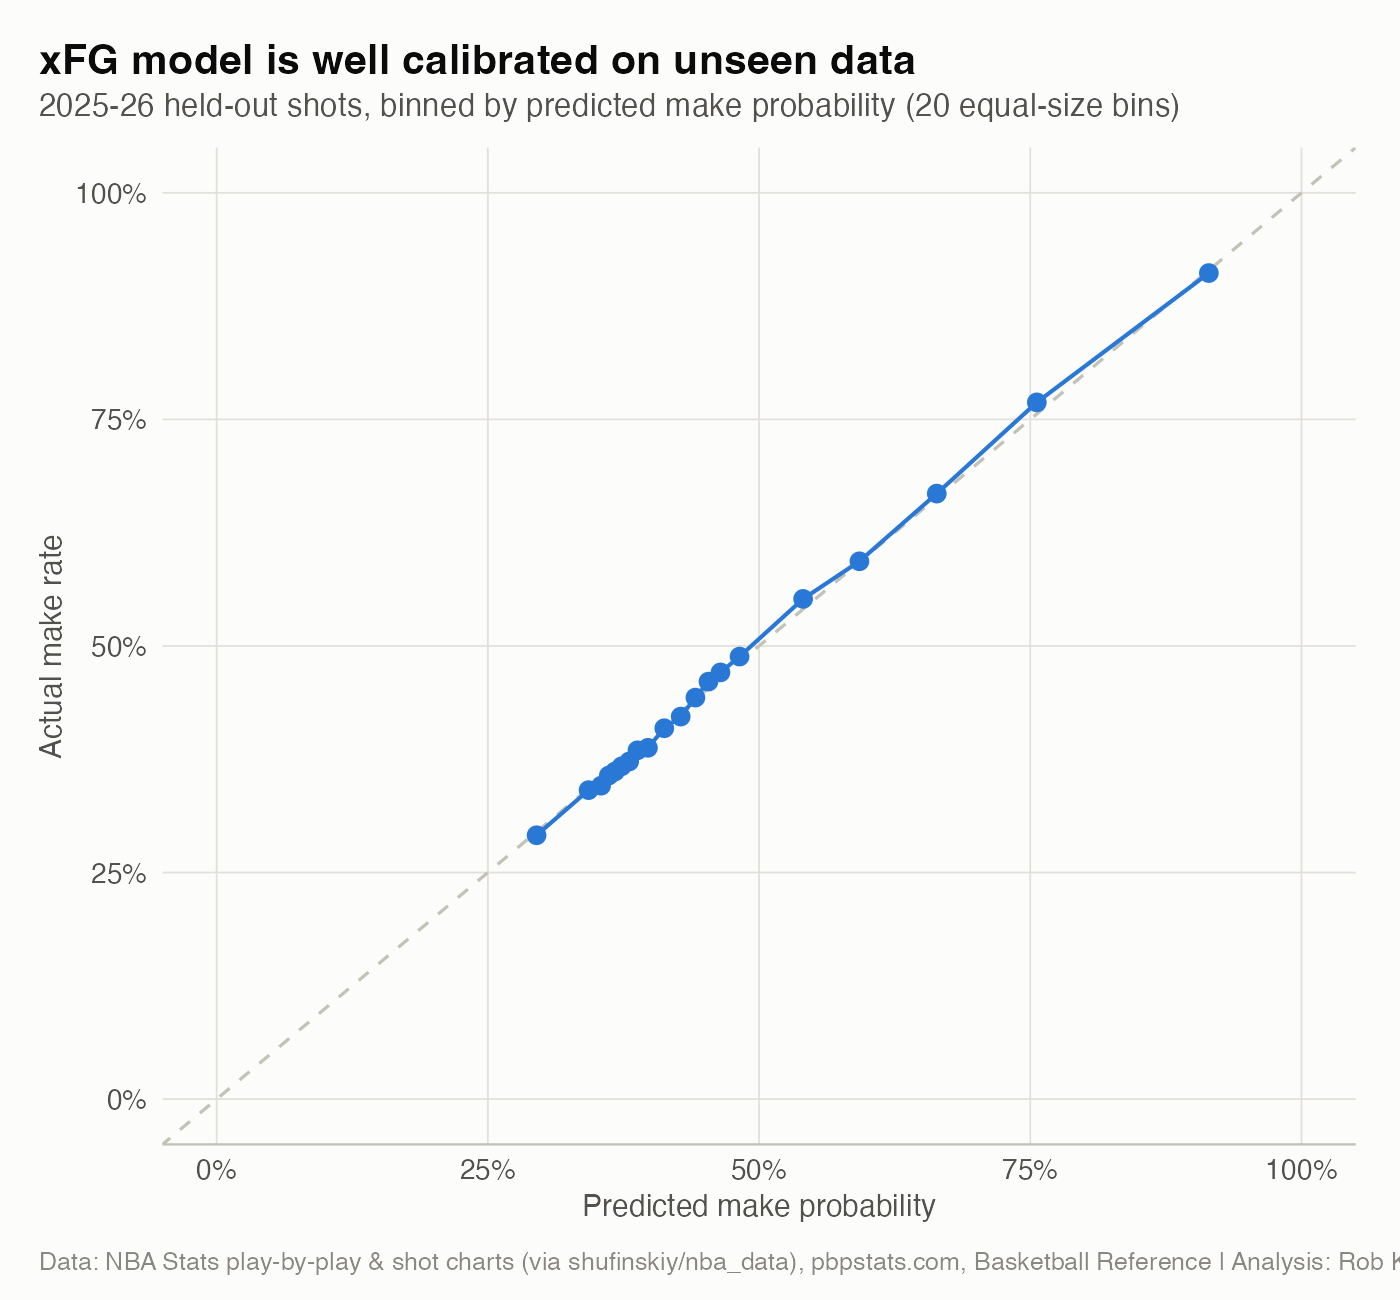
The model is gradient-boosted trees (xgboost) trained on 5,841,268 shots from 1996-97 to 2023-24 (6,307,970 in total), tuned on 2024-25, and evaluated on the held-out 2025-26 season:
xFG improves log-loss by 2.7% over a zone-average baseline and is closely calibrated: shots predicted to go in 60% of the time go in about 60% of the time.
Distance (46% of the model’s gain) and shot family (32%) do most of the work. For the final index, each shot’s xFG is cross-fitted: games are split into five folds, and every shot is scored by a model that never saw its game.
The eight components
Show code
comp <-data.table(Axis =c(rep("Skill", 4), rep("Whistle", 4)),Component = COMP_LABELS[c(names(SKILL_W), names(WHISTLE_W))],Definition =c("(Actual FG points − expected FG points) per field-goal attempt","Share of made field goals that were unassisted","1 − expected effective FG% of the player's attempts (higher = harder shots)","Travels + offensive fouls (incl. charges) per 100 scoring attempts (FGA + 0.44·FTA + TOV); fewer is better","Shooting-foul FTA per FGA minus the rate predicted by shot diet, usage and position","(Three-shot fouls + 3PT and-ones) per 100 three-point attempts (incl. fouled misses)","Points from shooting-foul free throws ÷ total points","And-ones on mid-range and 3PT jumpers per 100 such attempts"),Weight =c(SKILL_W /sum(SKILL_W), WHISTLE_W /sum(WHISTLE_W)))gt(comp, groupname_col ="Axis") |>fmt_percent(Weight, decimals =0) |>tab_options(table.width = gt::pct(100))
Component
Definition
Weight
Skill
Shot-making above expected
(Actual FG points − expected FG points) per field-goal attempt
45%
Self-creation
Share of made field goals that were unassisted
25%
Shot difficulty
1 − expected effective FG% of the player's attempts (higher = harder shots)
Points from shooting-foul free throws ÷ total points
20%
Perimeter and-one rate
And-ones on mid-range and 3PT jumpers per 100 such attempts
15%
Excess free-throw rate is the key whistle metric. Rim-attackers should shoot more free throws, so a regression predicts each player’s shooting-foul free-throw rate from shot diet (rim, paint, mid-range, corner-three and three-point shares), a usage proxy, and position, fitted separately for each era with season fixed effects. The residual, free throws beyond what that profile earns, is the excess. This separates a center finishing through contact from a guard manufacturing fouls on jumpers.
Only shooting-foul free throws count. Intentional fouls (hack-a-big, fouling a good free-throw shooter late in a close game) are the defense’s strategy, not the shooter’s foul-seeking, and would otherwise penalize elite free-throw shooters for being fouled on purpose.
Shrinkage, standardization, and the composite
Empirical-Bayes shrinkage. A 1,000-minute season still contains only a few dozen three-shot fouls or and-ones, so raw rates for small samples produce fake extremes. Each count rate is shrunk toward its season mean with a beta-binomial prior; continuous measures (shot-making, difficulty, excess FT rate) use a normal-normal prior. Priors are estimated each season from players with reliable samples.
Within-season z-scores. Every component is standardized against the same season’s qualifying scorers, which neutralizes era-wide shifts (the 2004-05 hand-check removal, the three-point boom, league-wide whistle trends). Each component’s z is capped at ±4 so no single metric can dominate.
Two axes. Skill Score and Whistle Score are the weighted means of their components’ z-scores, each re-standardized within season.
EHI = 0.4 × Skill − 0.6 × Whistle, re-standardized within season and mapped to 0–100 (50 = average qualifier, 15 points = one standard deviation).
Archetypes come from the signs of the two axes: Ethical Hooper (skill ≥ 0, whistle < 0), Whistle Artist (skill ≥ 0, whistle ≥ 0), Downhill Bully (skill < 0, whistle ≥ 0), Grinder (skill < 0, whistle < 0).
Why these weights
Whistle outweighs skill (60% / 40%). In the slang, an ethical hooper doesn’t have to be the most skilled player, but they cannot live at the line.
Shot-making above expected gets the largest skill weight because it is the most direct measure of skill net of shot selection. Self-creation captures handles and shot creation. Difficulty and footwork are supporting signals.
Excess FT rate gets the largest whistle weight because it is the cleanest whistle measure net of shot diet. Three-point fouls are the purest jump-shot foul-drawing signal available back to 1996-97. FT share of points captures raw free-throw reliance relative to scoring volume. Perimeter and-ones are noisier, so they get the least weight.
Who qualifies
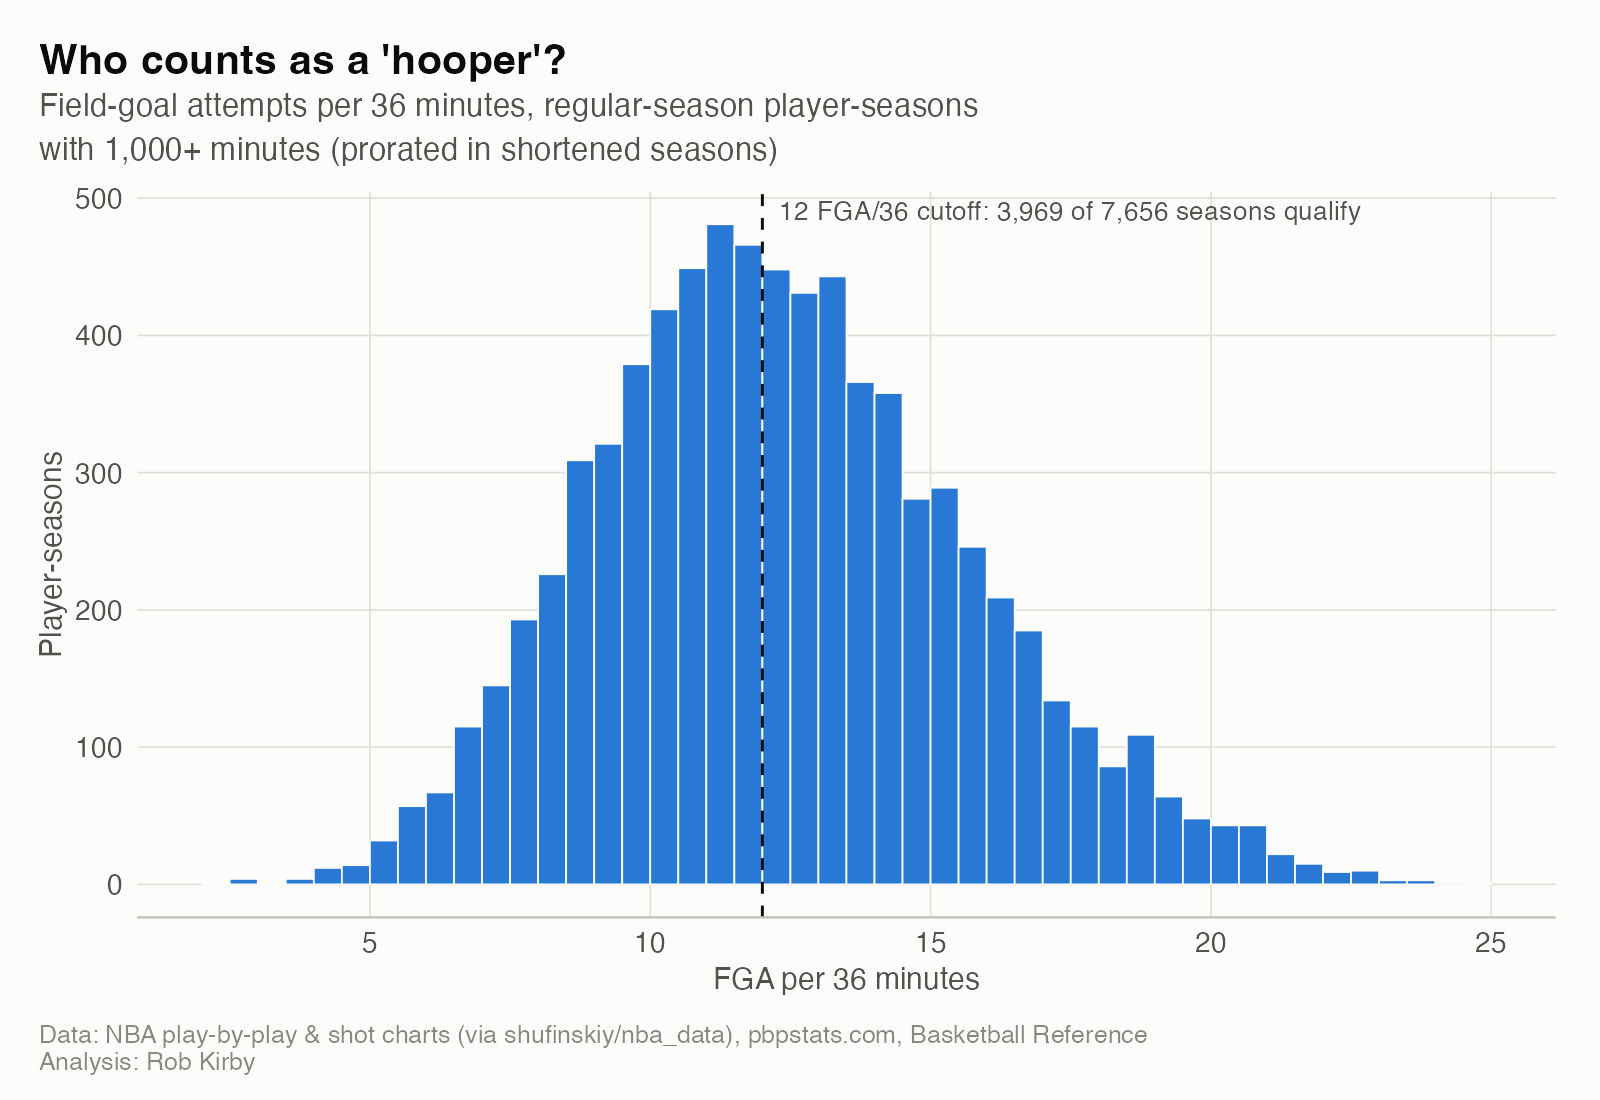
A hooper is a real scorer: a regular-season player-season qualifies with ≥ 1,000 minutes (prorated in the shortened 1998-99, 2011-12, 2019-20 and 2020-21 seasons) and ≥ 12 field-goal attempts per 36 minutes. Role players who rarely shoot shouldn’t top the “ethical” list by default. Playoffs use ≥ 150 minutes. Careers need ≥ 4 qualifying seasons. Career EHI is the minutes-weighted average; peak EHI is the best minutes-weighted three-consecutive-qualifying-season stretch.
That yields 4,022 regular-season and 1,302 playoff player-seasons, and 417 careers.
Sensitivity: does the ranking depend on the weights?
The composite was rebuilt under equal weights, principal-component weights, and with each component dropped in turn. Career rankings barely move:
The rankings are most sensitive to dropping shot-making above expected (ρ = 0.889), the largest skill input, and otherwise stay at ρ ≥ 0.938.
Changes from the original design
Each was triggered by a result that looked wrong, checked against the data, and documented in the project’s NOTES.md:
“Share of and-ones on jumpers” became perimeter and-ones per 100 perimeter attempts. The share version mostly measured shot diet (it tracked a player’s share of jump shots closely), so a pure spot-up shooter whose handful of and-ones all came on jumpers looked like a foul-baiter.
Free-throw metrics use shooting-foul free throws only, removing intentional fouls (see above).
Usage is approximated by scoring attempts per 36 minutes, since true usage rate needs team possession data from the blocked stats server. Within-season standardization makes the two nearly equivalent.
Whistle weighted 60/40 over skill, reflecting the slang definition.
Limitations
No defender distance before 2013-14. xFG knows where and how a shot was taken, not how well it was contested. A player who takes many tightly-contested shots will look like a better shot-maker than one who takes open looks from the same spots.
Missed-shot fouls can only be located for threes. Play-by-play records a shooting foul on a missed two but not where the shot was, so jump-shot foul-baiting on twos is only visible through and-ones and the excess-FT residual.
Officiating varies by crew, season and arena. Within-season standardization removes league-wide shifts but not crew-to-crew noise.
Flopping is only recorded in play-by-play from 2023-24 and is too sparse to use.
Style, not morality. Drawing fouls is legal and frequently smart. A low EHI means a player scored differently, not wrongly.